Example 2: Realtime clusters of tweets. 例2. リアルタイムでツイートのクラスターを作成します。
It's working with Leaflet as an alternative to Leaflet.markercluster. Leaflet.markerclusterの代替としてLeafletと連携しています。
The library is designed for large datasets or live situations. The memory consumption is kept low and the library is fast on mobile devices, thanks to a new algorithm inspired by collision detection in physical engines. このライブラリは、大規模なデータセットやライブの状況を想定して設計されています。物理エンジンの衝突検出にヒントを得た新しいアルゴリズムを採用しているため、メモリ消費量は低く抑えられており、ライブラリはモバイルデバイス上で高速に動作します。
Features 特徴
Realtime リアルタイム
The clusters can be updated in realtime. It's perfect for live datasets or datasets you want to filter at runtime. クラスターをリアルタイムで更新することができます。ライブデータセットや、実行時にフィルタリングしたいデータセットに最適です。
These values are tested with random positions, on a recent laptop, using Chrome 38. One half of markers is moving randomly and the other half is static. It is also fast enough for mobile devices. これらの値は、最近のノートパソコンで、Chrome 38を使用して、ランダムな位置でテストされています。マーカーの半分はランダムに動き、残りの半分は静止しています。モバイル端末でも十分に高速です。
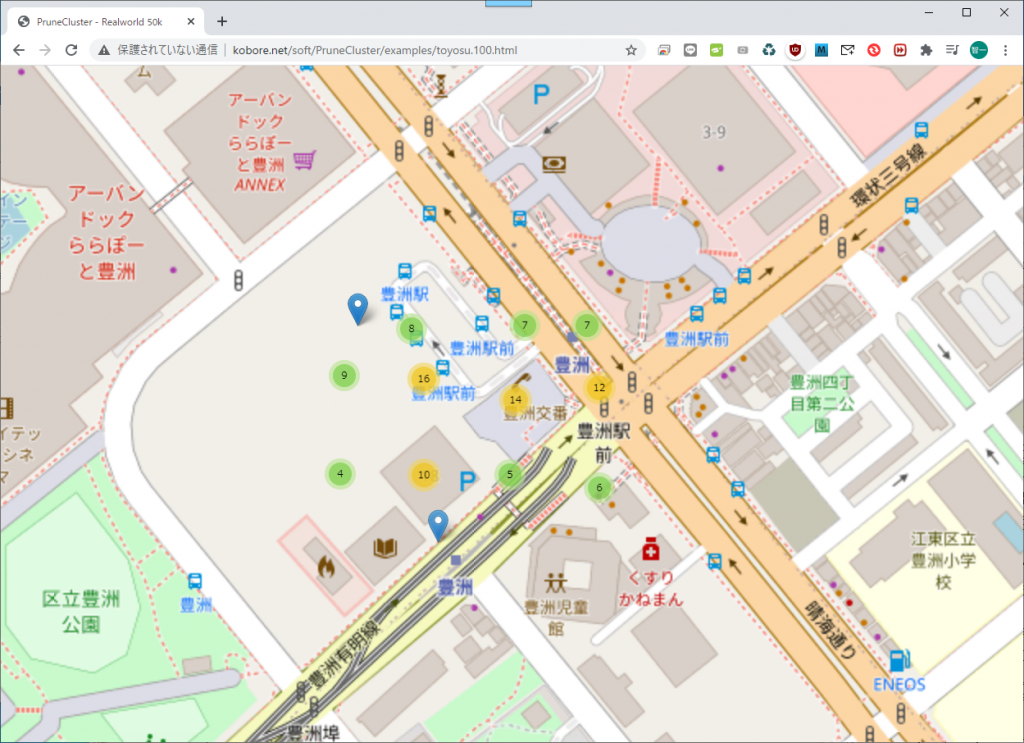
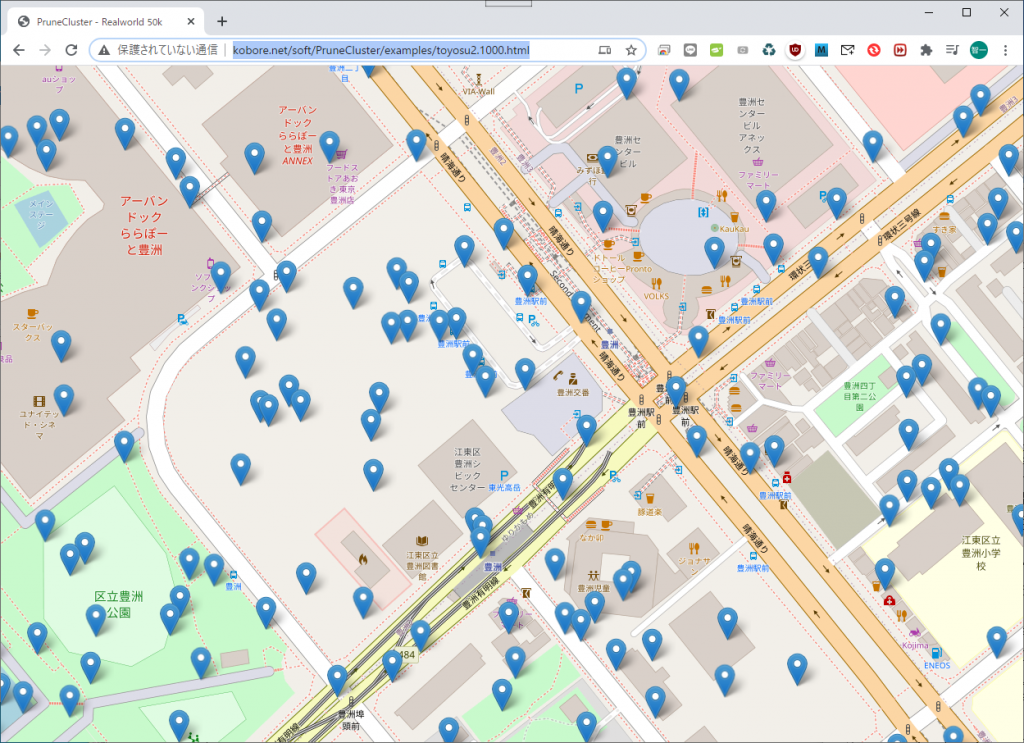
If you prefer real world data, the 50k Leaflet.markercluster example is computed in 60ms (original). 実世界のデータをお望みなら、50k Leaflet.markercluster の例は 60ms (オリジナル) で計算されています。
Weight ウエイト
You can specify the weight of each marker. 各マーカーのウエイトを指定することができます。
For example, you may want to add more importance to a marker representing an incident, than a marker representing a tweet. 例えば、ツイートを表すマーカーよりも、事件を表すマーカーの方がウエイトが高い場合があります。
Categories カテゴリ
You can specify a category for the markers. Then a small object representing the number of markers for each category is attached to the clusters. This way, you can create cluster icons adapted to their content. マーカーのカテゴリを指定することができます。そして、各カテゴリのマーカーの数を表す小さなオブジェクトがクラスタに添付されます。このようにして、その内容に合わせたクラスタアイコンを作成することができます。
Dynamic cluster size 動的なクラスタサイズ
The size of a cluster can be adjusted on the fly (Example) クラスターの大きさをその場で調整可能(例)
Filtering フィルタリング
The markers can be filtered easily with no performance cost. 性能コストをかけずに、簡単にマーカーをろ過することができます。
Usage 使用方法
Classic Way 古典的な方法
	<!-- In <head> -->
	<link rel="stylesheet" href="https://unpkg.com/leaflet@1.2.0/dist/leaflet.css"
  integrity="sha512-M2wvCLH6DSRazYeZRIm1JnYyh22purTM+FDB5CsyxtQJYeKq83arPe5wgbNmcFXGqiSH2XR8dT/fJISVA1r/zQ=="
  crossorigin=""/>

	<!-- In <head> or before </body> -->
	<script src="https://unpkg.com/leaflet@1.2.0/dist/leaflet.js"
  integrity="sha512-lInM/apFSqyy1o6s89K4iQUKg6ppXEgsVxT35HbzUupEVRh2Eu9Wdl4tHj7dZO0s1uvplcYGmt3498TtHq+log=="
  crossorigin=""></script>
	<script src="PruneCluster/dist/PruneCluster.js"></script>
Webpack & NPM
npm install exports-loader prunecluster
import { PruneCluster, PruneClusterForLeaflet } from 'exports-loader?PruneCluster,PruneClusterForLeaflet!prunecluster/dist/PruneCluster.js'
Example 例
var pruneCluster = new PruneClusterForLeaflet();

...
var marker = new PruneCluster.Marker(59.8717, 11.1909);
pruneCluster.RegisterMarker(marker);
...

leafletMap.addLayer(pruneCluster);
You can specify the size and margin which affect when your clusters and markers will be merged. クラスターとマーカーがマージされるときに影響するサイズとマージンを指定できます。
size defaults to 120 and margin to 20. サイズはデフォルトで120、マージンは20に設定されています。
Update a position ポジションの更新
marker.Move(lat, lng);
Deletions 削除
// Remove all the markers
pruneCluster.RemoveMarkers();

// Remove a list of markers
pruneCluster.RemoveMarkers([markerA,markerB,...]);
Set the category カテゴリを設定する
The category can be a number or a string, but in order to minimize the performance cost, it is recommended to use numbers between 0 and 7. カテゴリは数字でも文字列でも構いませんが、パフォーマンスコストを最小限に抑えるために、0~7の間の数字を使用することをお勧めします。
marker.category = 5;
Set the weight ウエイトを設定する
marker.weight = 4;
Filtering フィルタリング
marker.filtered = true|false;
Set the clustering size クラスタリングサイズを設定する
You can specify a number indicating the area of the cluster. Higher number means more markers "merged". (Example) クラスタの領域を示す数値を指定することができます。数値が大きいほど、より多くのマーカーが "マージ "されていることを意味します。(例)
pruneCluster.Cluster.Size = 87;
Apply the changes 変更を適用する
Must be called when ANY changes are made. 変更が行われたときに呼び出されなければなりません。
pruneCluster.ProcessView();
Add custom data to marker object マーカーオブジェクトにカスタムデータを追加
Each marker has a data object where you can specify your data. 各マーカーには、データを指定できるデータオブジェクトがあります。
Setting up a Leaflet icon or a Leaflet popup リーフレットアイコンやリーフレットのポップアップを設定する
You can attach to the markers an icon object and a popup content マーカーにはアイコンオブジェクトとポップアップコンテンツを添付することができます。
marker.data.icon = L.icon(...);  // See http://leafletjs.com/reference.html#icon
marker.data.popup = 'Popup content';
Faster leaflet icons より高速なリーフレットアイコン
If you have a lot of markers, you can create the icons and popups on the fly in order to improve their performance. マーカーが多い場合は、その場でアイコンやポップアップを作成しておくとパフォーマンスが向上します。
You can also override the PreapareLeafletMarker method. You can apply listeners to the markers here. PreapareLeafletMarkerメソッドをオーバーライドすることもできます。ここではマーカーにリスナーを適用することができます。
pruneCluster.PrepareLeafletMarker = function(leafletMarker, data) {
    leafletMarker.setIcon(/*... */); // See http://leafletjs.com/reference.html#icon
    //listeners can be applied to markers in this function
    leafletMarker.on('click', function(){
    //do click event logic here
    });
    // A popup can already be attached to the marker
    // bindPopup can override it, but it's faster to update the content instead
    if (leafletMarker.getPopup()) {
        leafletMarker.setPopupContent(data.name);
    } else {
        leafletMarker.bindPopup(data.name);
    }
};
Setting up a custom cluster icon カスタム クラスター アイコンの設定
pruneCluster.BuildLeafletClusterIcon = function(cluster) {
    var population = cluster.population, // the number of markers inside the cluster
        stats = cluster.stats; // if you have categories on your markers

    // If you want list of markers inside the cluster
    // (you must enable the option using PruneCluster.Cluster.ENABLE_MARKERS_LIST = true)
    var markers = cluster.GetClusterMarkers()

    ...

    return icon; // L.Icon object (See http://leafletjs.com/reference.html#icon);
};
Listening to events on a cluster クラスタ上のイベントを聞く
To listen to events on the cluster, you will need to override the BuildLeafletCluster method. A click event is already specified on m, but you can add other events like mouseover, mouseout, etc. Any events that a Leaflet marker supports, the cluster also supports, since it is just a modified marker. A full list of events can be found here. クラスタ上のイベントをリッスンするには、BuildLeafletClusterメソッドをオーバーライドする必要があります。クリックイベントはすでに m で指定されていますが、マウスオーバーやマウスアウトなどの他のイベントを追加することができます。リーフレットマーカーがサポートしているイベントはすべて、クラスタもサポートしています。イベントの完全なリストはこちらを参照してください。
Below is an example of how to implement mouseover and mousedown for the cluster, but any events can be used in place of those. 以下にクラスタのマウスオーバーとマウスダウンの実装例を示しますが、これらの代わりに任意のイベントを使用することができます。
pruneCluster.BuildLeafletCluster = function(cluster, position) {
      var m = new L.Marker(position, {
        icon: pruneCluster.BuildLeafletClusterIcon(cluster)
      });

      m.on('click', function() {
        // Compute the  cluster bounds (it's slow : O(n))
        var markersArea = pruneCluster.Cluster.FindMarkersInArea(cluster.bounds);
        var b = pruneCluster.Cluster.ComputeBounds(markersArea);

        if (b) {
          var bounds = new L.LatLngBounds(
            new L.LatLng(b.minLat, b.maxLng),
            new L.LatLng(b.maxLat, b.minLng));

          var zoomLevelBefore = pruneCluster._map.getZoom();
          var zoomLevelAfter = pruneCluster._map.getBoundsZoom(bounds, false, new L.Point(20, 20, null));

          // If the zoom level doesn't change
          if (zoomLevelAfter === zoomLevelBefore) {
            // Send an event for the LeafletSpiderfier
            pruneCluster._map.fire('overlappingmarkers', {
              cluster: pruneCluster,
              markers: markersArea,
              center: m.getLatLng(),
              marker: m
            });

            pruneCluster._map.setView(position, zoomLevelAfter);
          }
          else {
            pruneCluster._map.fitBounds(bounds);
          }
        }
      });
      m.on('mouseover', function() {
        //do mouseover stuff here
      });
      m.on('mouseout', function() {
        //do mouseout stuff here
      });

      return m;
    };
};
Redraw the icons アイコンを再描画
Marker icon redrawing with a flag: マーカーアイコンを旗で再描画。
This library was developed in context of the BRIDGE project. It is now supported by the community and we thank the contributors. このライブラリはBRIDGEプロジェクトの文脈で開発されました。現在はコミュニティによってサポートされており、貢献者に感謝しています。
Licence ライセンス
The source code of this library is licensed under the MIT License. このライブラリのソースコードはMITライセンスの下でライセンスされています。