Keyword: golang csv write 書き出し ライン
package main
import (
"database/sql"
"encoding/csv"
"fmt"
"log"
"os"
_ "github.com/lib/pq"
)
func main() {
file, err := os.Open("yamaguchi_area.csv")
if err != nil {
log.Fatal(err)
}
defer file.Close()
r := csv.NewReader(file)
rows, err := r.ReadAll() // csvを一度に全て読み込む
if err != nil {
log.Fatal(err)
}
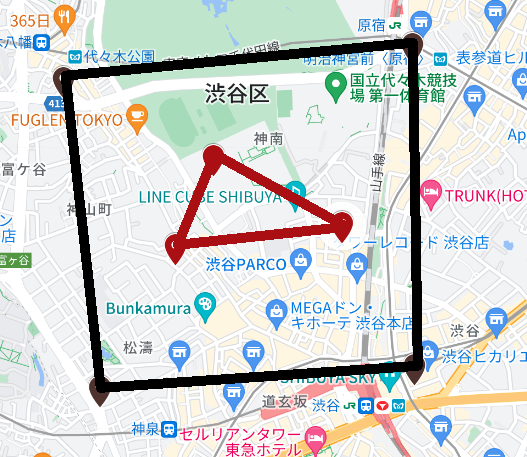
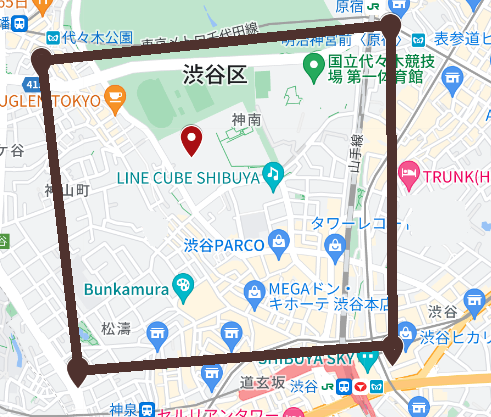
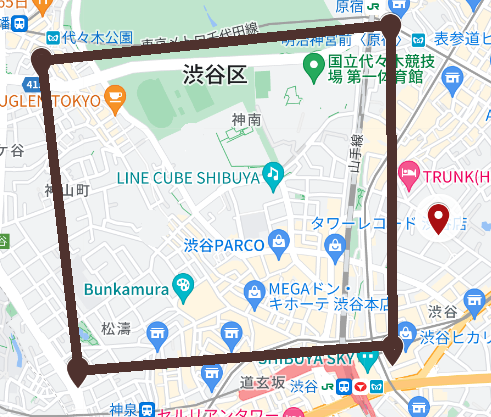
str := "SELECT ST_Covers(st_geomfromtext('POLYGON(("
// 行ごとに
for i, row := range rows {
if i == 0 {
continue // CSVのヘッダー行を無視
}
str += row[1] + " " + row[2] + ", " // rowのままで取り出せば、文字列になっている
}
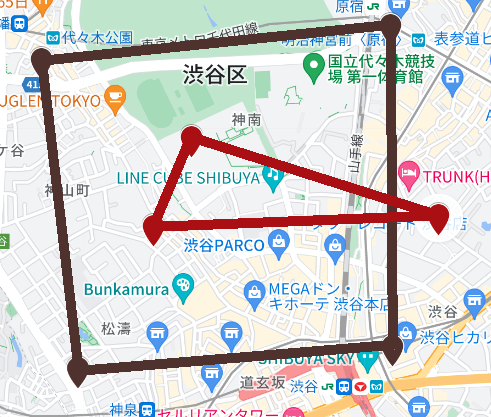
str1 := str[:len(str)-2] + "))'),st_geomfromtext('LINESTRING(" // 上記の最後の", "を削除して、文字列を追加
dbMap, err := sql.Open("postgres",
"user=postgres password=password host=192.168.0.23 port=15432 dbname=yama_db sslmode=disable")
log.Println("------------------ map db open ------------------")
if err != nil {
log.Fatal("OpenError: ", err)
}
defer dbMap.Close()
///////////////////////////////////////
file2, err2 := os.Open("20220518weekday.csv")
if err2 != nil {
log.Fatal(err2)
}
defer file2.Close()
r2 := csv.NewReader(file2)
rows2, err2 := r2.ReadAll() // csvを一度に全て読み込む
if err != nil {
log.Fatal(err2)
}
file3, err3 := os.Create("testtest.csv")
if err3 != nil {
panic(err)
}
w := csv.NewWriter(file3)
for _, row := range rows2 {
//if i == 0 {
// continue // CSVのヘッダー行を無視
//}
str2 := str1 + row[0] + " " + row[1] + ", " + row[2] + " " + row[3]
str2 += ")'))"
//fmt.Println(str2)
rows1, err := dbMap.Query(str2)
if err != nil {
log.Fatal(err)
}
defer rows1.Close()
//var dt string
var dt bool
for rows1.Next() {
if err := rows1.Scan(&dt); err != nil {
fmt.Println(err)
}
// fmt.Println(dt)
if dt {
output := []string{row[0], row[1], row[2], row[3], row[4]}
//fmt.Println("output:", output)
if err = w.Write(output); err != nil {
log.Fatal(err)
}
}
}
err = rows1.Err()
if err != nil {
panic(err)
}
defer w.Flush()
if err := w.Error(); err != nil {
log.Fatal(err)
}
}
}重要なのは、以下のコード
file3, err3 := os.Create("testtest.csv")
if err3 != nil {
panic(err)
}w := csv.NewWriter(file3)
output := []string{row[0], row[1], row[2], row[3], row[4]}
//fmt.Println("output:", output)if err = w.Write(output); err != nil {
log.Fatal(err)
}defer w.Flush()