2024,江端さんの技術メモ

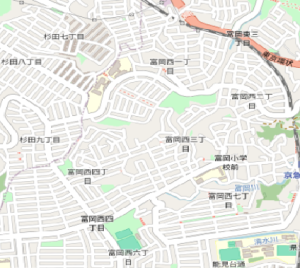
この地図のプロパティは、424 x 379
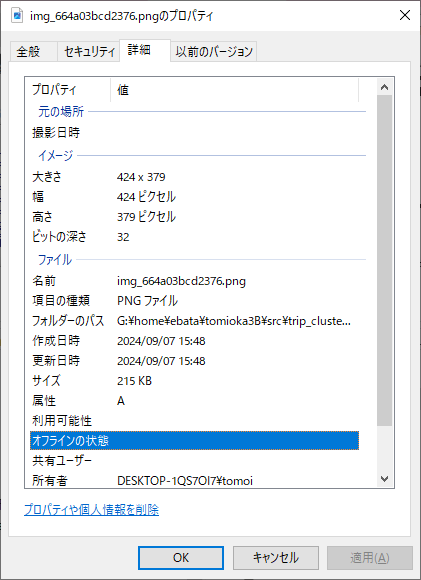
で、

set datafile separator "," # データの区切り文字をコンマに指定
set title "Cluster Data with Map" # グラフタイトル
set xlabel "X-axis" # X軸のラベル
set ylabel "Y-axis" # Y軸のラベル
set zlabel "Z-axis" # Z軸のラベル
set xrange [0:1] # X軸の範囲をデータに合わせて調整
set yrange [0:1] # Y軸の範囲をデータに合わせて調整
set zrange [0:1] # Z軸の範囲
set ticslevel 0 # Z軸を平面上に表示
set xyplane at 0 # XY平面をZ=0に設定
set view 40, 30, 1, 1 # 視点の角度とスケールを調整

# 地図画像をXY平面に表示 (画像のX軸、Y軸範囲を設定し、Z軸は0に固定)
splot "img_664a03bcd2376.png" binary filetype=png dx=1.0/424 dy=1.0/379 with rgbimage, \
'Cluster1.csv' using 1:2:3 with points pt 7 ps 2 lc rgb "blue" title 'Cluster 1', \
'Cluster2.csv' using 1:2:3 with points pt 7 ps 2 lc rgb "blue" notitle, \
'Cluster3.csv' using 1:2:3 with points pt 7 ps 2 lc rgb "blue" notitle, \
'Cluster4.csv' using 1:2:3 with points pt 7 ps 2 lc rgb "blue" notitle, \
'Cluster5.csv' using 1:2:3 with points pt 7 ps 2 lc rgb "blue" notitle, \
'Cluster6.csv' using 1:2:3 with points pt 7 ps 2 lc rgb "blue" notitle, \
'Cluster7.csv' using 1:2:3 with points pt 7 ps 2 lc rgb "blue" notitle, \
'Cluster8.csv' using 1:2:3 with points pt 7 ps 2 lc rgb "blue" notitle, \
'Cluster9.csv' using 1:2:3 with points pt 7 ps 2 lc rgb "blue" notitle, \
'Cluster10.csv' using 1:2:3 with points pt 7 ps 2 lc rgb "blue" notitle, \
'Cluster11.csv' using 1:2:3 with points pt 7 ps 2 lc rgb "blue" notitle, \
'Cluster12.csv' using 1:2:3 with points pt 7 ps 2 lc rgb "blue" notitle, \
'Cluster13.csv' using 1:2:3 with points pt 7 ps 2 lc rgb "blue" notitle, \
'Cluster14.csv' using 1:2:3 with points pt 7 ps 2 lc rgb "blue" notitle, \
'Cluster15.csv' using 1:2:3 with points pt 7 ps 2 lc rgb "blue" notitle, \
'Cluster16.csv' using 1:2:3 with points pt 7 ps 2 lc rgb "blue" notitle, \
'Cluster17.csv' using 1:2:3 with points pt 7 ps 2 lc rgb "blue" notitle, \
'Cluster18.csv' using 1:2:3 with points pt 7 ps 2 lc rgb "blue" notitle, \
'Cluster19.csv' using 1:2:3 with points pt 7 ps 2 lc rgb "blue" notitle, \
'Cluster20.csv' using 1:2:3 with points pt 7 ps 2 lc rgb "blue" notitle, \
'Cluster21.csv' using 1:2:3 with points pt 7 ps 2 lc rgb "blue" notitle, \
'Cluster22.csv' using 1:2:3 with points pt 7 ps 2 lc rgb "blue" notitle, \
'Cluster23.csv' using 1:2:3 with points pt 7 ps 2 lc rgb "blue" notitle, \
'Cluster24.csv' using 1:2:3 with points pt 7 ps 2 lc rgb "blue" notitle, \
'Cluster25.csv' using 1:2:3 with points pt 7 ps 2 lc rgb "blue" notitle, \
'Cluster26.csv' using 1:2:3 with points pt 7 ps 2 lc rgb "blue" notitle, \
'Cluster27.csv' using 1:2:3 with points pt 7 ps 2 lc rgb "blue" notitle, \
'Cluster28.csv' using 1:2:3 with points pt 7 ps 2 lc rgb "blue" notitle, \
'Cluster29.csv' using 1:2:3 with points pt 7 ps 2 lc rgb "blue" notitle, \
'Cluster30.csv' using 1:2:3 with points pt 7 ps 2 lc rgb "blue" notitle, \
'Cluster31.csv' using 1:2:3 with points pt 7 ps 2 lc rgb "blue" notitle, \
'Cluster32.csv' using 1:2:3 with points pt 7 ps 2 lc rgb "blue" notitle, \
'Cluster33.csv' using 1:2:3 with points pt 7 ps 2 lc rgb "blue" notitle, \
'Cluster34.csv' using 1:2:3 with points pt 7 ps 2 lc rgb "blue" notitle, \
'Cluster35.csv' using 1:2:3 with points pt 7 ps 2 lc rgb "blue" notitle, \
'Cluster36.csv' using 1:2:3 with points pt 7 ps 2 lc rgb "blue" notitle, \
'Cluster37.csv' using 1:2:3 with points pt 7 ps 2 lc rgb "blue" notitle, \
'Cluster38.csv' using 1:2:3 with points pt 7 ps 2 lc rgb "blue" notitle, \
'Cluster39.csv' using 1:2:3 with points pt 7 ps 2 lc rgb "blue" notitle, \
'Cluster40.csv' using 1:2:3 with points pt 7 ps 2 lc rgb "blue" notitle, \
'Cluster41.csv' using 1:2:3 with points pt 7 ps 2 lc rgb "blue" notitle
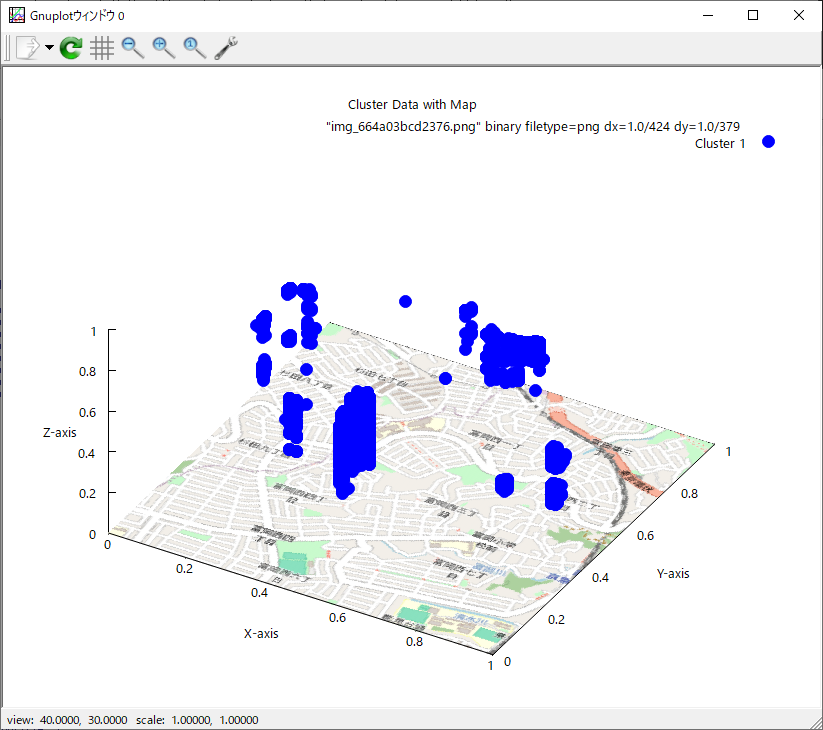
cluster1.csvの内容はこんな感じ
0.63, 0.65, 0.58
0.62, 0.65, 0.56
0.61, 0.65, 0.56
0.61, 0.65, 0.56
0.62, 0.65, 0.56
0.62, 0.66, 0.55
0.63, 0.65, 0.55
0.62, 0.65, 0.56
0.62, 0.66, 0.57
0.62, 0.65, 0.58
0.62, 0.65, 0.58
(後略)
2024,江端さんの技術メモ

chartjs-plugin-streaming.js は、今も便利に使わせて貰っています。

Golangから送り込んだデータを、chartjs-plugin-streaming(リアルタイムストリーミングデータ向け Chart.js プラグイン)で表示してみた件

で、今回、リアルタイムは必要なくて、単にグラフ表示が必要になりました。

このライブラリが必要です。https://www.papaparse.com/ からダウンロードできます。

sample.htmlという名前で以下のファイルをセーブします。

<!DOCTYPE html>
<html lang="en">
<head>
  <meta charset="UTF-8">
  <meta name="viewport" content="width=device-width, initial-scale=1.0">
  <title>CSV to Chart.js</title>
  <script src="./chart.js"></script>
  <script src="./papaparse.min.js"></script> <!-- 正しいPapaParseのCDN -->
</head>
<body>
  <canvas id="myChart" width="400" height="200"></canvas>
  <script>
    // サンプルのCSVファイルを読み込む処理
    fetch('sample.csv')
      .then(response => response.text())
      .then(csvData => {
        Papa.parse(csvData, {
          header: true,
          dynamicTyping: true,
          complete: function(results) {
            const data = results.data;
            const labels = [];
            const values = [];

            // CSVファイルからラベルとデータを抽出
            data.forEach(row => {
              labels.push(row['label_column']);  // 'label_column' はラベル用の列名
              values.push(row['value_column']);  // 'value_column' は値用の列名
            });

            // Chart.jsでグラフを描画
            const ctx = document.getElementById('myChart').getContext('2d');
            const chart = new Chart(ctx, {
              type: 'line',  // 折れ線グラフの例
              data: {
                labels: labels,
                datasets: [{
                  label: 'CSV Data',
                  data: values,
                  borderColor: 'rgba(75, 192, 192, 1)',
                  borderWidth: 1,
                  fill: false
                }]
              },
              options: {
                scales: {
                  x: {
                    beginAtZero: true
                  },
                  y: {
                    beginAtZero: true
                  }
                }
              }
            });
          }
        });
      });
  </script>
</body>
</html>

sample.csv は以下の通り。

label_column,value_column
January,10
February,15
March,20
April,25
May,30
June,35
July,40
August,45
September,50
October,55
November,60
December,65

あとは、

python3 -m http.server 8000

などとしてサーバを立ち上げておいて、ブラウザから、

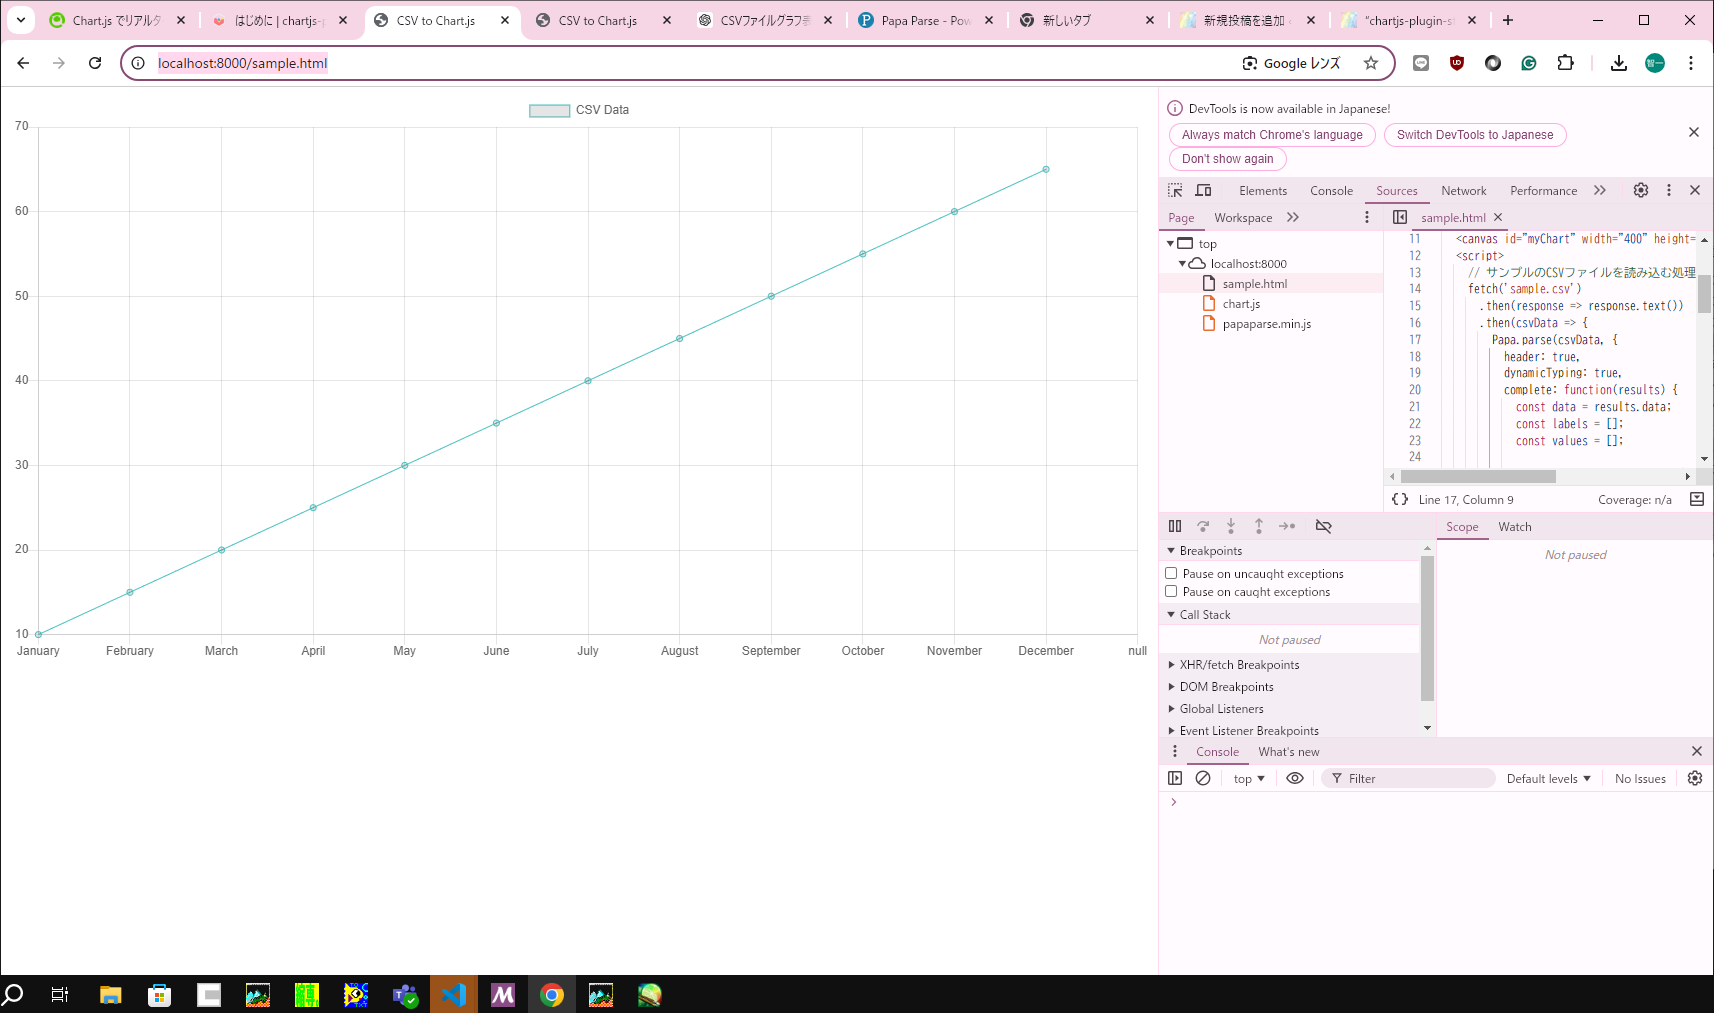
http://localhost:8000/sample.html

とすれば、

2024,江端さんの技術メモ

Keyword: WordPress アップロード 拡張子

WP Add Mime Types 管理設定で、
py = text/py
を追加したのですが *.pyのアップロードができません

WP Add Mime Types プラグインで .py ファイルのアップロードを許可する設定を行ったにもかかわらず、アップロードができない場合、いくつかの点を確認し、設定を調整する必要があります。

1. MIMEタイプの設定を確認する

text/py の代わりに、次の MIME タイプを試してみてください。

py = text/x-python

で、このあとブラウザでWordPressの立ち上げをしたらアップロードできるようになりました。
-----
Keyword: WordPress アップロード 拡張子

2024,江端さんの技術メモ

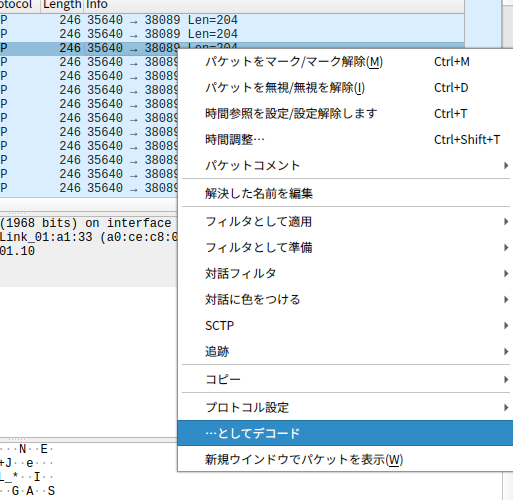
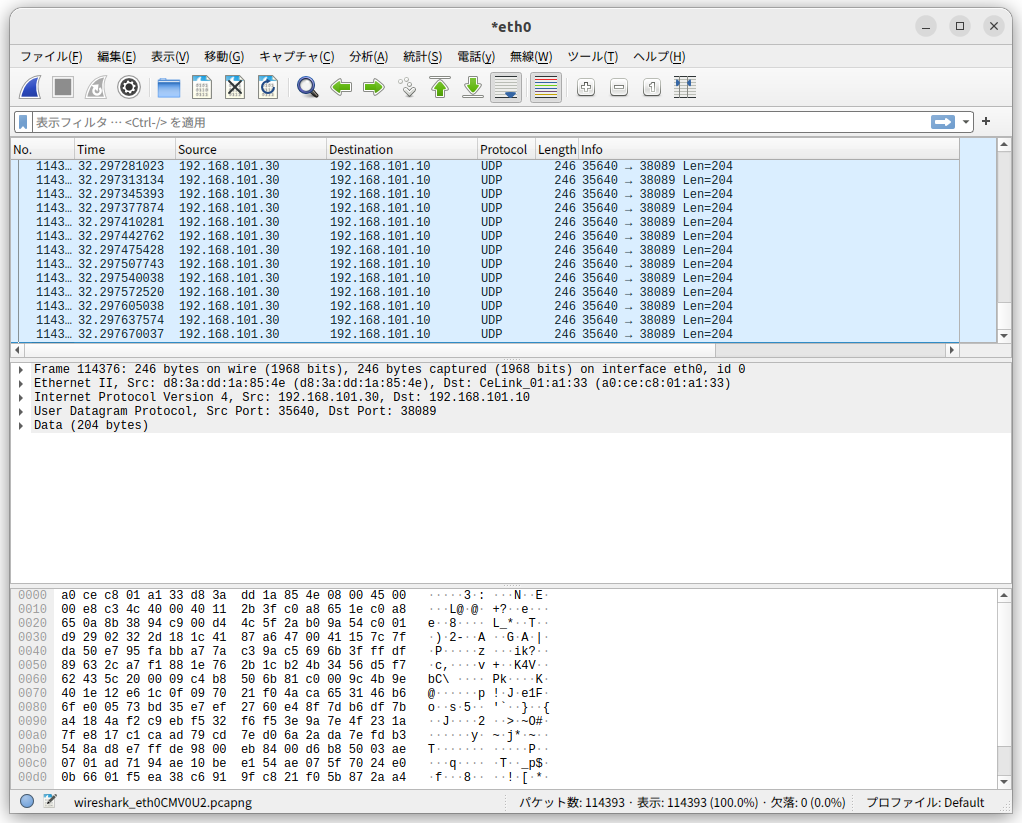
まず、ネットワークをキャプチャして、停止する

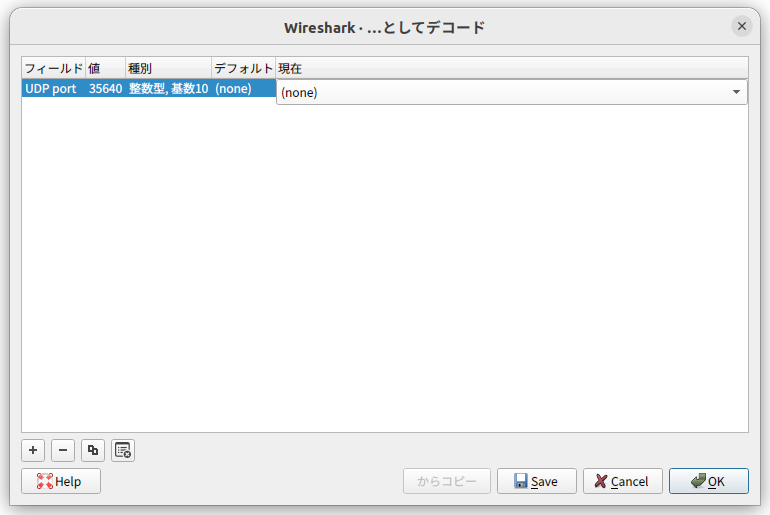
パケットの一つを選んで、「・・・としてデコード」を選択

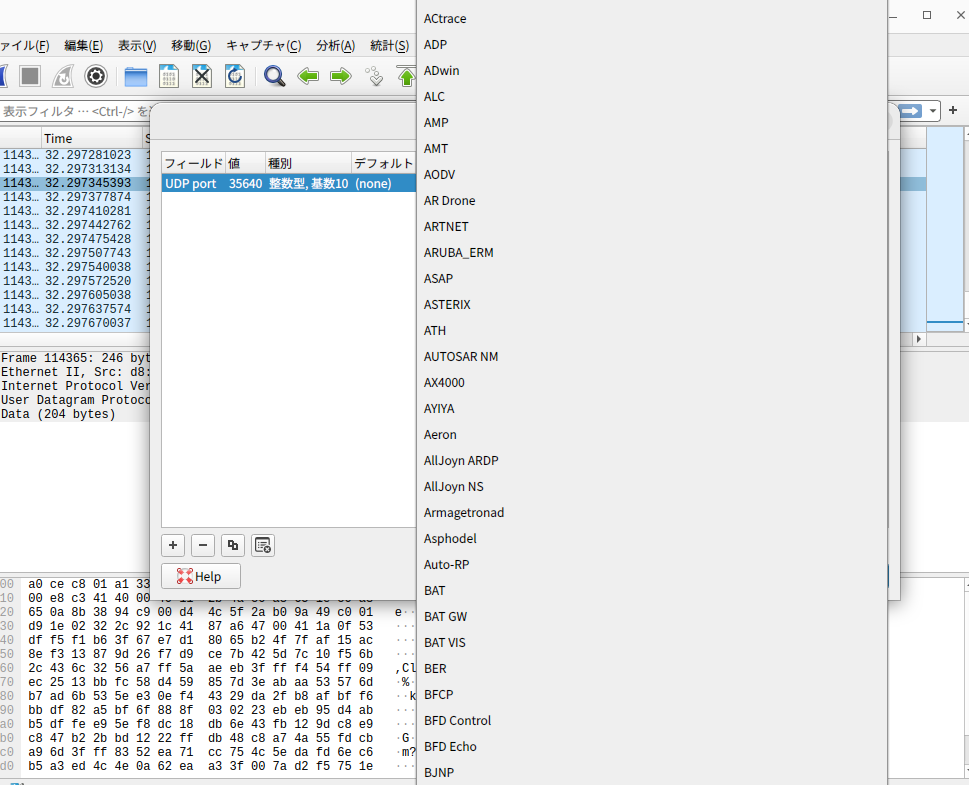
「現在」のところをクリック

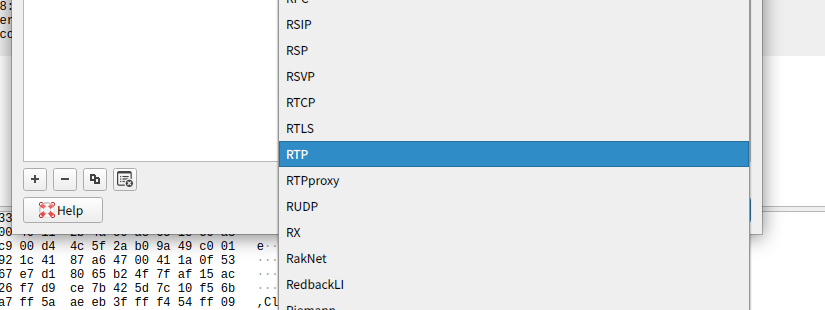
プロトコルとして「RTP」を選ぶ

XXXXX

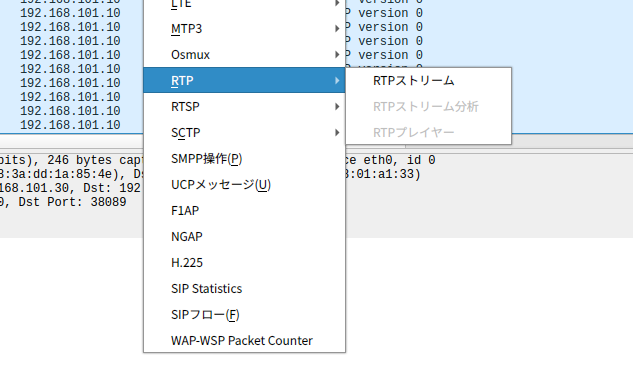
「電話(y)」のメニューを選択

「RTP」→「RTPストリーム」を選択

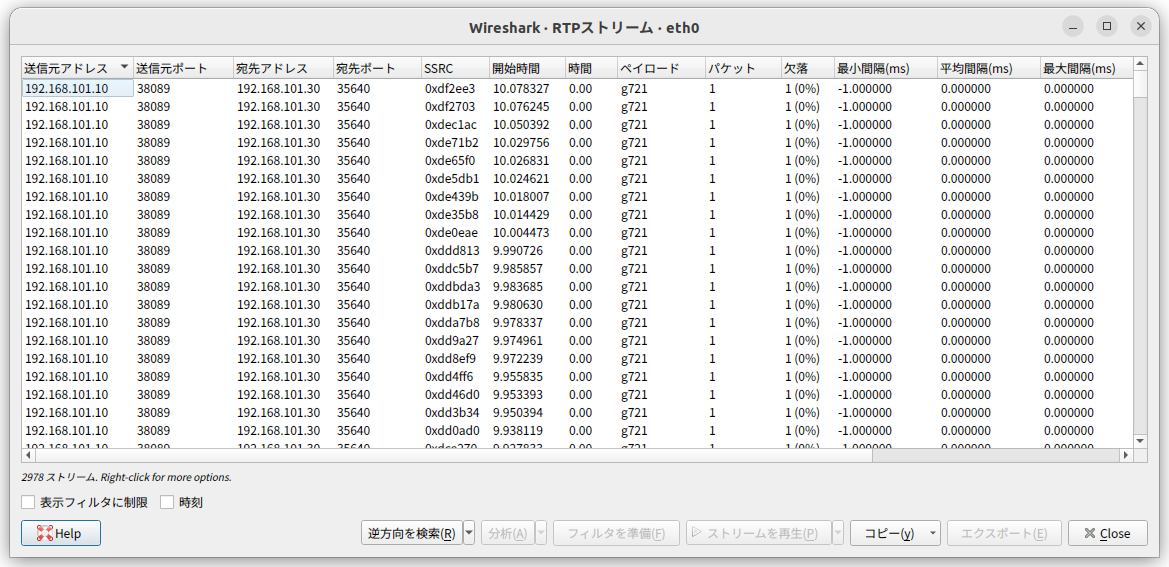
ストリーム一式が表示される

現在、「wiresharkでRTPのパケットロスを検知する方法」には至っていません。

2024,江端さんの技術メモ

ラズパイに、ラズパイにWebカメラ C270n HD 720Pを接続して、RTSPカメラを作ろうとしました。

以下のソースコードをコンパイルしました。

/*
  dummy_usbcam_0.2.c
  
  ■環境設定を行います。
  sudo apt-get update
  sudo apt-get install libgstrtspserver-1.0-dev

  export PKG_CONFIG_PATH=/usr/lib/x86_64-linux-gnu/pkgconfig:$PKG_CONFIG_PATH

 
  ■プログラムをコンパイルして実行するには、以下のコマンドを使用します:
  gcc -o dummy_usbcam_0.2 dummy_usbcam_0.2.c `pkg-config --cflags --libs gstreamer-1.0 gstreamer-rtsp-server-1.0`

  ./dummy_usbcam_0.2 -r rtsp://127.0.0.1:8554/custom -d /dev/video0

  ■また、ヘルプメッセージを表示するには、以下のコマンドを使用します:

  ./dummy_usbcam_0.2 -h

  ■稼動確認環境
   (車上) 192.168.101.30
   cam@cam-desktop:~/cpp/src$ ./dummy_usbcam_0.2
   cam@cam-desktop:~/cpp/src$ ./abc_vtp_0.1 -i 192.168.101.10 -p 38089 -r rtsp://127.0.0.1:8554/test

   (地上) 192.168.101.10
pt@pt-desktop:~/go/src$ more srt_rtsp_server_38089.sh 

#!/bin/bash
gst-launch-1.0 srtsrc uri=srt://:38089 keep-listening=true ! decodebin ! autovid
eosink

  
*/

#include <gst/gst.h>
#include <gst/rtsp-server/rtsp-server.h>
#include <stdio.h>
#include <string.h>

void print_usage(const char *prog_name) {
    g_print("Usage: %s -r [RTSP_URL] -d [DEVICE]\n", prog_name);
    g_print("Default RTSP_URL: rtsp://127.0.0.1:8554/test\n");
    g_print("Default DEVICE: /dev/video0\n");
    g_print("Example: %s -r rtsp://127.0.0.1:8554/test -d /dev/video0\n", prog_name);
}

int main(int argc, char *argv[]) {
    GMainLoop *loop;
    GstRTSPServer *server;
    GstRTSPMountPoints *mounts;
    GstRTSPMediaFactory *factory;
    const char *default_url = "rtsp://127.0.0.1:8554/test";
    const char *default_device = "/dev/video0";
    const char *rtsp_url = default_url;
    const char *device = default_device;
    char path[256] = "/test";
    char service[6] = "8554";  // ポート番号のデフォルト値

    for (int i = 1; i < argc; i++) {
        if (strcmp(argv[i], "-h") == 0) {
            print_usage(argv[0]);
            return 0;
        } else if (strcmp(argv[i], "-r") == 0 && i + 1 < argc) {
            rtsp_url = argv[++i];
            // RTSP URLのポート番号とパス部分を抽出
            const char *url_port = strchr(rtsp_url + strlen("rtsp://"), ':');
            if (url_port != NULL) {
                url_port++;
                const char *url_path = strchr(url_port, '/');
                if (url_path != NULL) {
                    strncpy(path, url_path, sizeof(path) - 1);
                    path[sizeof(path) - 1] = '\0';  // Null terminatorを追加

                    int port_length = url_path - url_port;
                    if (port_length < sizeof(service)) {
                        strncpy(service, url_port, port_length);
                        service[port_length] = '\0';  // Null terminatorを追加
                    }
                }
            }
        } else if (strcmp(argv[i], "-d") == 0 && i + 1 < argc) {
            device = argv[++i];
        }
    }

    gst_init(&argc, &argv);

    loop = g_main_loop_new(NULL, FALSE);

    server = gst_rtsp_server_new();
    gst_rtsp_server_set_service(server, service);

    mounts = gst_rtsp_server_get_mount_points(server);

    factory = gst_rtsp_media_factory_new();
    char launch_string[512];
    snprintf(launch_string, sizeof(launch_string),
             "( v4l2src device=%s ! videoconvert ! x264enc speed-preset=ultrafast tune=zerolatency ! rtph264pay pt=96 name=pay0 )",
             device);
    gst_rtsp_media_factory_set_launch(factory, launch_string);

    gst_rtsp_mount_points_add_factory(mounts, path, factory);

    g_object_unref(mounts);

    gst_rtsp_server_attach(server, NULL);

    g_print("Stream ready at %s with device %s\n", rtsp_url, device);
    g_main_loop_run(loop);

    return 0;
}

で、

$ ./dummy_usbcam_0.2

をして、

$ gst-launch-1.0 rtspsrc location=rtsp://127.0.0.1:8554/test ! decodebin ! autovideosink

で、映像を受信しようとしたのですが、動きませんでした。

-----

そもそも、"/dev/video0"が見つかりません。

Raspberry PiがWebカメラを認識できるように、必要なパッケージをインストールします。

$ sudo apt-get update
$ sudo apt-get install v4l-utils

v4l-utilsは、Video4Linux(V4L)デバイスを操作するためのツールセットです。

次に、WebカメラがRaspberry Piに認識されているかを確認します。以下のコマンドを実行して、デバイスが認識されているか確認します。

$ lsusb

このコマンドは、接続されているUSBデバイスのリストを表示します。

Bus 001 Device 004: ID 046d:0825 Logitech, Inc. Webcam C270

が表示されれば、成功です。

で、あとはGStreamerでデバイスが動くことを確認しました。

$ gst-launch-1.0 v4l2src device=/dev/video0 ! videoconvert ! autovideosink

後は念の為、GStreamerのインストールができているかを確認して下さい。

$ sudo apt-get update
$ sudo apt-get install gstreamer1.0-tools gstreamer1.0-plugins-base gstreamer1.0-plugins-good gstreamer1.0-plugins-bad gstreamer1.0-plugins-ugly gstreamer1.0-libav

で、

$ gst-launch-1.0 v4l2src device=/dev/video0 ! videoconvert ! autovideosink

で、ローカルにカメラ映像が表示されれば成功です。

で、この後、プログラムを起動して、リモートで、

$ gst-launch-1.0 rtspsrc location=rtsp://192.168.0.200:8554/test ! decodebin ! autovideosink

(192.168.0.200はラズパイのIPアドレスです)

で、RTSPプロトコルで転送された映像が表示されるようになりました。

以上


2024,江端さんの技術メモ

.emacs はこんなかんじ

;; 英字フォントを設定
(set-face-attribute 'default nil
:family "Ubuntu Mono"
:height 120
:weight 'normal
:width 'normal)

;; 日本語フォントを設定
(set-fontset-font t 'japanese-jisx0208
		  (font-spec :family "Noto Sans CJK JP" :size 14))


(require 'skk-autoloads)
(setq skk-user-directory "~/.emacs.d/skk")
;(setq skk-large-jisyo "/usr/share/skk/SKK-JISYO.L")
(setq skk-large-jisyo "~/.emacs.d/skk/SKK-JISYO.L")
(setq skk-server-host "localhost")
(setq skk-server-portnum 1178)
(global-set-key (kbd "C-x C-j") 'skk-mode)

;; ネイティブコンパイルの警告を無効にする
(setq native-comp-async-report-warnings-errors nil)

で、あとはこんなことをやっておく

$ wget https://skk-dev.github.io/dict/SKK-JISYO.L.gz
$ gunzip SKK-JISYO.L.gz
$ mkdir -p ~/.emacs.d/skk
$ mv SKK-JISYO.L ~/.emacs.d/skk/

$ sudo apt update
$ sudo apt install ddskk

とりあえず「動けばいい」の方向で。

2024,江端さんの技術メモ

C言語のプログラムで、コマンドパラメタを入力する部分をつくっていたのですが、ファイルを作ってほしくないケースが出てきました。

// 引数からIPアドレス、ポート、RTSP URL、ファイル名を取得
    char *srt_ip = DEFAULT_IP;
    int srt_port = DEFAULT_PORT;
    char *rtsp = DEFAULT_RTSP;
    char *filename = DEFAULT_FILENAME;
    int udp_port = DEFAULT_UDP_PORT;

    for (int i = 1; i < argc; i++) {
      if (strcmp(argv[i], "-i") == 0 && i + 1 < argc) {
        srt_ip = argv[i + 1];
        i++;
      } else if (strcmp(argv[i], "-p") == 0 && i + 1 < argc) {
        srt_port = atoi(argv[i + 1]);
        i++;
      } else if (strcmp(argv[i], "-r") == 0 && i + 1 < argc) {
        rtsp = argv[i + 1];
        i++;
      } else if (strcmp(argv[i], "-f") == 0 && i + 1 < argc) {
        filename = argv[i + 1];
        i++;
      } else if (strcmp(argv[i], "-u") == 0 && i + 1 < argc) {  // UDPポート番号の引数を追加
        udp_port = atoi(argv[i + 1]);
        i++;
      } else {
        printf("Usage: %s [-i ip_address] [-p port] [-r rtsp_url] [-f filename] [-u udp_port]\n", argv[0]);
	    printf("./abc_vtp_0.3 -i 192.168.101.10 -p 38090 -r rtsp://cam:Cam12345@192.168.0.11/Src/MediaInput/stream_1 -f 2jcie/data_test2.csv -u 12346 \n");
    	    printf("-f /dev/null とすることでSRTメトリックス情報は廃棄されます \n");
	    printf("-u 0 とすることで制御用スレッドは起動しなくなります\n ");


        return 1;
      }
    }
    
    printf("IP: %s\nPort: %d\nRTSP: %s\nFilename: %s\nUDP Port: %d\n", srt_ip, srt_port, rtsp, filename, udp_port);

しかし上記のプログラムでは、ファイル名を無視すると、デフォルトのファイル名を選んでしまいます。そんでもって、プログラムの改造もしたくありませんでした。

今更ながらなのですが、ファイル名を

/dev/null

とすると、ファイルを作らずにデータを捨ててくれるようです。
(コマンドプロンプトでしか使えないと思っていた)

いや、本当に助かった。変なコード追加しなくて済んだし。

それ以上に、この程度のことを、今の今まで、私が知らなかったことが驚きです。

まあ、私の力量などこの程度です(乾いた笑い)。


2024,江端さんの技術メモ

ubuntu 22.04をホストOSとして、ubuntu24.04 をゲストOSとした、そのゲストosの環境で、fastapiをインストールしようとしましたが、上手く動きませんでした。

pythonでFastAPIを試す

cam@cam-desktop:/$ pip3 install fastapi uvicorn error: externally-managed-environment といわれました。
「システム全体のPython環境にパッケージをインストールする必要がある場合は、--break-system-packagesオプションを使用して強制的にインストールすることも可能です」
と言われました。
「システム全体」でかまわなかったので、強行しました。
cam@cam-desktop:~/testapi$ pip install fastapi uvicorn --break-system-packages
$make testapi
$cd testapi
$touch main.py

以下のサンプルコードを main.py に記述します。

from fastapi import FastAPI

app = FastAPI()

@app.get("/")
def read_root():
    return {"Hello": "World"}
で、
$ uvicorn main:app --host 0.0.0.0 --port 8000
http://localhost:8000 で稼働確認できましたので、とりあえずここからです。
cam@cam-desktop:~/fastapi6d$ pip3 install request --break-system-packages
で、(私の場合)ようやく起動しました。

2024,江端さんの技術メモ

GISでシミュレーションを行う上で、鈴木紀明先生のこの方法を使い倒させていただいております。

先生には大変申し訳ないのですが、もし、このリンクが消えたら私にとって大打撃なので、先生に無許諾で切り取り&貼り付けをさせて頂いております(御叱り頂ければ、このページを即時抹消致します)。

2024,江端さんの技術メモ

key-word ubuntu emacs 漢字 汚い

.emacsまたはinit.elファイルに次のコードを追加します。

;; 英字フォントを設定
(set-face-attribute 'default nil
:family "Ubuntu Mono"
:height 120
:weight 'normal
:width 'normal)

;; 日本語フォントを設定
(set-fontset-font t 'japanese-jisx0208
(font-spec :family "Noto Sans CJK JP" :size 14))