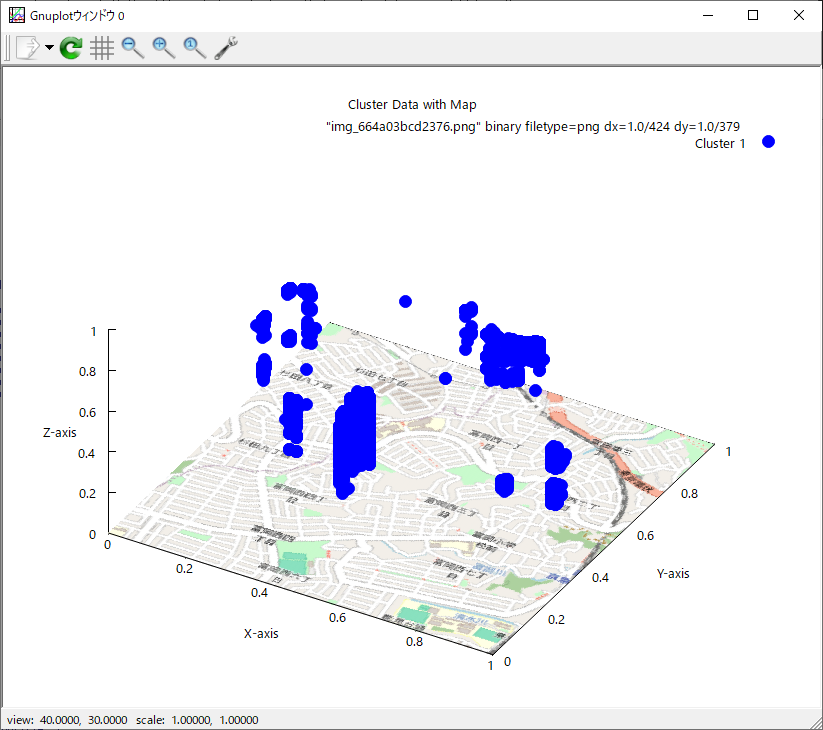
gnuplotで地図を張りつける方法 (splot "img_664a03bcd2376.png" binary filetype=png dx=1.0/424 dy=1.0/379 with rgbimage, \)
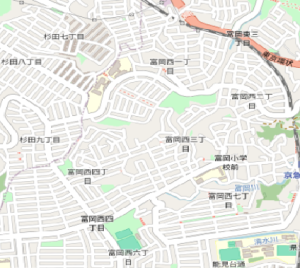
この地図のプロパティは、424 x 379
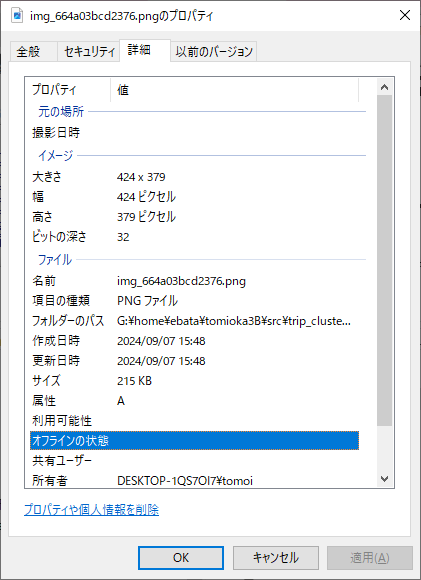
で、
set datafile separator "," # データの区切り文字をコンマに指定
set title "Cluster Data with Map" # グラフタイトル
set xlabel "X-axis" # X軸のラベル
set ylabel "Y-axis" # Y軸のラベル
set zlabel "Z-axis" # Z軸のラベル
set xrange [0:1] # X軸の範囲をデータに合わせて調整
set yrange [0:1] # Y軸の範囲をデータに合わせて調整
set zrange [0:1] # Z軸の範囲
set ticslevel 0 # Z軸を平面上に表示
set xyplane at 0 # XY平面をZ=0に設定
set view 40, 30, 1, 1 # 視点の角度とスケールを調整
# 地図画像をXY平面に表示 (画像のX軸、Y軸範囲を設定し、Z軸は0に固定)
splot "img_664a03bcd2376.png" binary filetype=png dx=1.0/424 dy=1.0/379 with rgbimage, \
'Cluster1.csv' using 1:2:3 with points pt 7 ps 2 lc rgb "blue" title 'Cluster 1', \
'Cluster2.csv' using 1:2:3 with points pt 7 ps 2 lc rgb "blue" notitle, \
'Cluster3.csv' using 1:2:3 with points pt 7 ps 2 lc rgb "blue" notitle, \
'Cluster4.csv' using 1:2:3 with points pt 7 ps 2 lc rgb "blue" notitle, \
'Cluster5.csv' using 1:2:3 with points pt 7 ps 2 lc rgb "blue" notitle, \
'Cluster6.csv' using 1:2:3 with points pt 7 ps 2 lc rgb "blue" notitle, \
'Cluster7.csv' using 1:2:3 with points pt 7 ps 2 lc rgb "blue" notitle, \
'Cluster8.csv' using 1:2:3 with points pt 7 ps 2 lc rgb "blue" notitle, \
'Cluster9.csv' using 1:2:3 with points pt 7 ps 2 lc rgb "blue" notitle, \
'Cluster10.csv' using 1:2:3 with points pt 7 ps 2 lc rgb "blue" notitle, \
'Cluster11.csv' using 1:2:3 with points pt 7 ps 2 lc rgb "blue" notitle, \
'Cluster12.csv' using 1:2:3 with points pt 7 ps 2 lc rgb "blue" notitle, \
'Cluster13.csv' using 1:2:3 with points pt 7 ps 2 lc rgb "blue" notitle, \
'Cluster14.csv' using 1:2:3 with points pt 7 ps 2 lc rgb "blue" notitle, \
'Cluster15.csv' using 1:2:3 with points pt 7 ps 2 lc rgb "blue" notitle, \
'Cluster16.csv' using 1:2:3 with points pt 7 ps 2 lc rgb "blue" notitle, \
'Cluster17.csv' using 1:2:3 with points pt 7 ps 2 lc rgb "blue" notitle, \
'Cluster18.csv' using 1:2:3 with points pt 7 ps 2 lc rgb "blue" notitle, \
'Cluster19.csv' using 1:2:3 with points pt 7 ps 2 lc rgb "blue" notitle, \
'Cluster20.csv' using 1:2:3 with points pt 7 ps 2 lc rgb "blue" notitle, \
'Cluster21.csv' using 1:2:3 with points pt 7 ps 2 lc rgb "blue" notitle, \
'Cluster22.csv' using 1:2:3 with points pt 7 ps 2 lc rgb "blue" notitle, \
'Cluster23.csv' using 1:2:3 with points pt 7 ps 2 lc rgb "blue" notitle, \
'Cluster24.csv' using 1:2:3 with points pt 7 ps 2 lc rgb "blue" notitle, \
'Cluster25.csv' using 1:2:3 with points pt 7 ps 2 lc rgb "blue" notitle, \
'Cluster26.csv' using 1:2:3 with points pt 7 ps 2 lc rgb "blue" notitle, \
'Cluster27.csv' using 1:2:3 with points pt 7 ps 2 lc rgb "blue" notitle, \
'Cluster28.csv' using 1:2:3 with points pt 7 ps 2 lc rgb "blue" notitle, \
'Cluster29.csv' using 1:2:3 with points pt 7 ps 2 lc rgb "blue" notitle, \
'Cluster30.csv' using 1:2:3 with points pt 7 ps 2 lc rgb "blue" notitle, \
'Cluster31.csv' using 1:2:3 with points pt 7 ps 2 lc rgb "blue" notitle, \
'Cluster32.csv' using 1:2:3 with points pt 7 ps 2 lc rgb "blue" notitle, \
'Cluster33.csv' using 1:2:3 with points pt 7 ps 2 lc rgb "blue" notitle, \
'Cluster34.csv' using 1:2:3 with points pt 7 ps 2 lc rgb "blue" notitle, \
'Cluster35.csv' using 1:2:3 with points pt 7 ps 2 lc rgb "blue" notitle, \
'Cluster36.csv' using 1:2:3 with points pt 7 ps 2 lc rgb "blue" notitle, \
'Cluster37.csv' using 1:2:3 with points pt 7 ps 2 lc rgb "blue" notitle, \
'Cluster38.csv' using 1:2:3 with points pt 7 ps 2 lc rgb "blue" notitle, \
'Cluster39.csv' using 1:2:3 with points pt 7 ps 2 lc rgb "blue" notitle, \
'Cluster40.csv' using 1:2:3 with points pt 7 ps 2 lc rgb "blue" notitle, \
'Cluster41.csv' using 1:2:3 with points pt 7 ps 2 lc rgb "blue" notitle
cluster1.csvの内容はこんな感じ
0.63, 0.65, 0.58
0.62, 0.65, 0.56
0.61, 0.65, 0.56
0.61, 0.65, 0.56
0.62, 0.65, 0.56
0.62, 0.66, 0.55
0.63, 0.65, 0.55
0.62, 0.65, 0.56
0.62, 0.66, 0.57
0.62, 0.65, 0.58
0.62, 0.65, 0.58
(後略)